The Promise That Keeps Breaking
Every engineering team has given the same promise: "We'll have it ready by Friday."
Sometimes it's true. Often it's not. And every time it slips, a little bit of trust erodes between engineering and the business.
The frustrating part is that most slips are predictable. Not because engineers are bad at estimating — but because the signals were there, and nobody was reading them.
Why Estimates Fail
The traditional estimation approach treats delivery as a planning problem: break the work down, assign story points, run a velocity calculation.
The problem is that this approach assumes a clean system. Real engineering delivery is full of noise:
Traditional point-based estimates treat these as exceptions. In reality, they're the baseline.
A Better Model: Flow-Based Forecasting
Instead of asking "how long will this take?", ask "what does our historical flow data say about tasks like this?"
This shift changes the question from prediction to probability.
Here's the basic approach:
Step 1: Measure Your Cycle Time Distribution
Look at the last 3-6 months of completed tasks. For each task, calculate the time from "started" to "done." You'll get a distribution — not a single number.
Step 2: Use Percentiles, Not Averages
The average cycle time is misleading. Use percentiles instead:
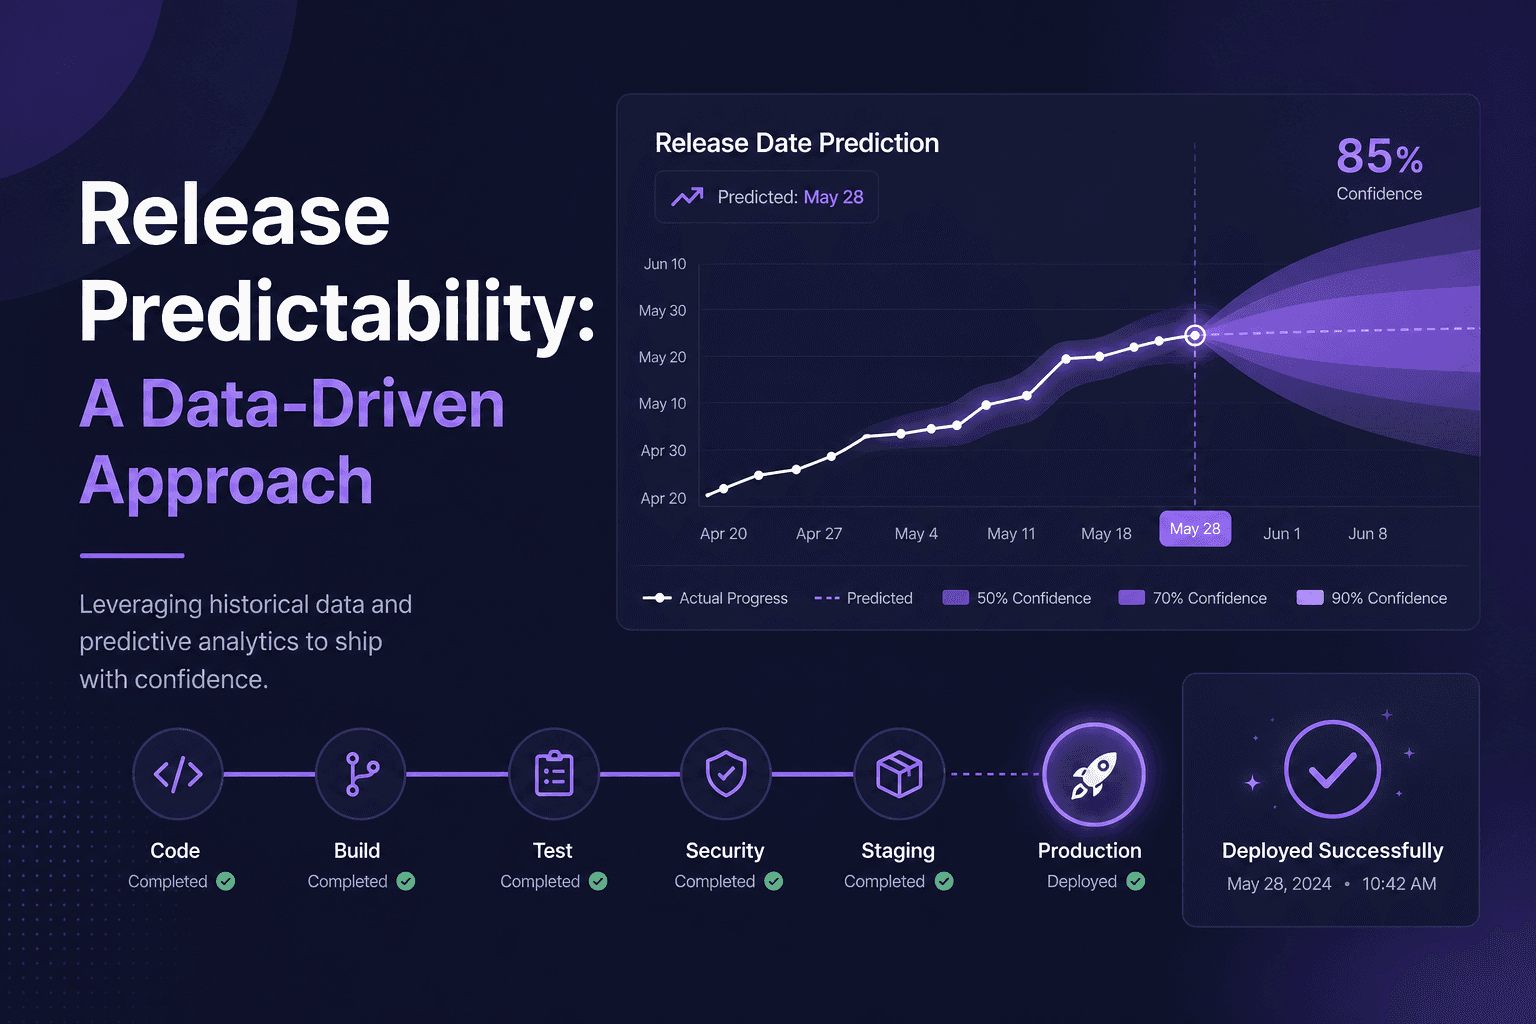
When a stakeholder asks "when will this ship?", you now have: "Based on our historical data, 85% of similar tasks complete within 8 business days."
Step 3: Monitor Leading Indicators
Cycle time tells you about past performance. Leading indicators tell you about the current state:
What This Does for Stakeholder Relationships
The biggest unlock isn't accuracy — it's the conversation it enables.
Instead of: *"We think we'll be done next week"* (and then it's not)
You can say: *"Based on current WIP and our 85th percentile cycle time for this complexity tier, there's about a 30% chance we slip past the target date. Here are the three items that are at risk."*
That's a different conversation. It's not pessimistic — it's honest. And it gives stakeholders something to act on, not just wait for.
Starting Small
You don't need a sophisticated tool to start. A spreadsheet with:
...is enough to build your first cycle time distribution. Run it for 60 days. See what your actual 85th percentile looks like. Use that number in your next planning meeting instead of a gut feel.
The goal is to replace *hope* with *probability*. You'll still miss sometimes. But you'll miss less often, and you'll see it coming earlier.